In Maricopa County, construction and manufacturing employ the same share of workers
Each accounts for 7.9% of employed residents, though nationally manufacturing employs 9.9% of workers and outranks construction.
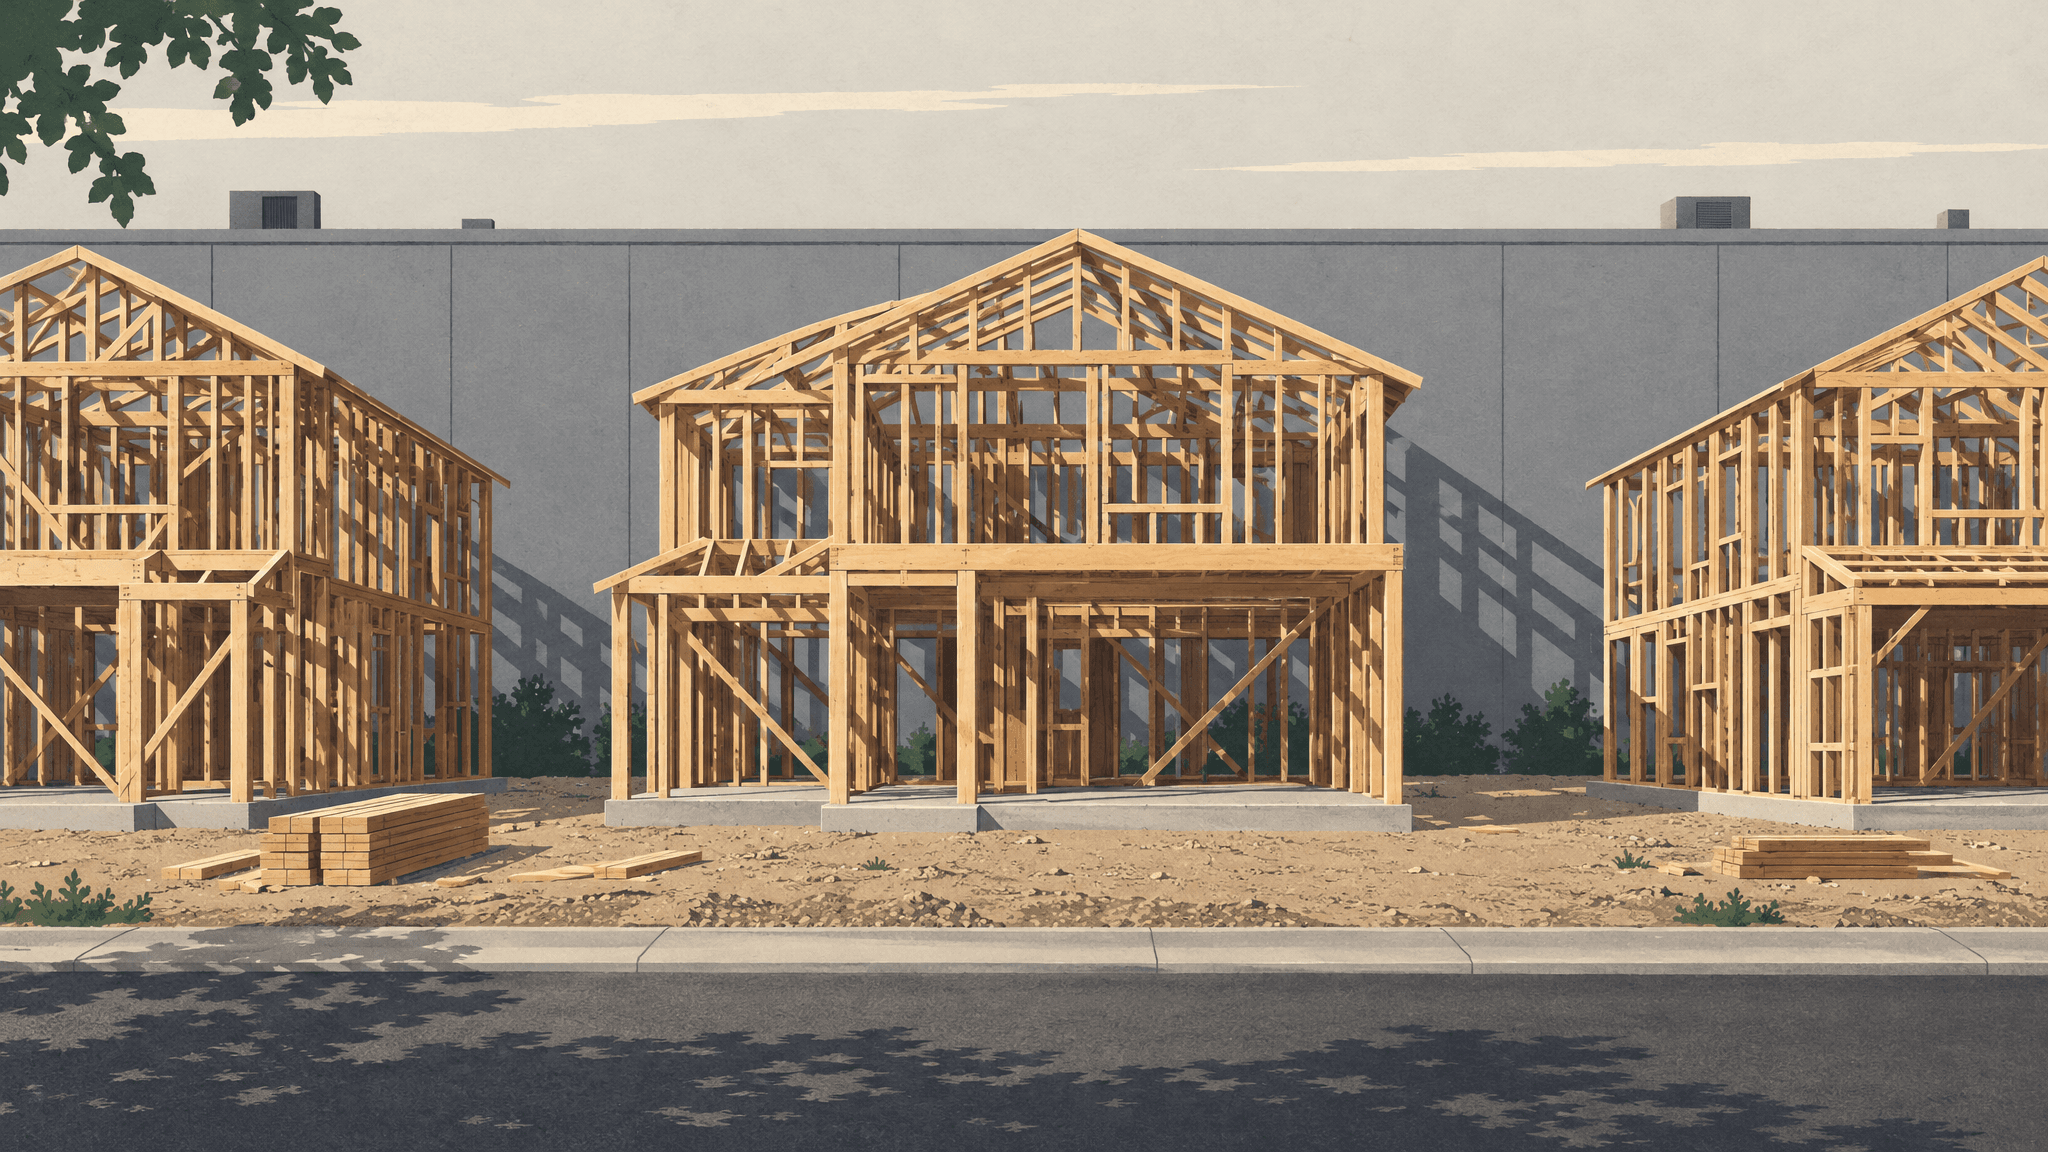
The Valley's workforce tilts toward the job site and away from the factory floor. Construction claims a bigger share of Maricopa County's working residents than it does nationwide, and manufacturing a smaller one, the Census Bureau's American Community Survey shows for 2020 through 2024.
In Maricopa County, construction and manufacturing each account for 7.9% of employed residents. Across the U.S., construction holds 6.9% of workers and manufacturing holds 9.9%, or about 1 in 10.
Neither is the Valley's biggest employer. That title belongs to the group that runs hospitals, clinics, schools and social service agencies. Education and health care employ 21% of the county's 2,265,286 working residents, a smaller share than in Arizona overall, at 22.1%, or the nation, at 23.5%.
Hospitals and classrooms lead, but trail the nation
The county's share of workers in education and health care sits 2.5 percentage points below the national figure, a gap larger than the survey's margin of error. Even so, the state's biggest single employer comes from this sector: Banner Health tops a ranking of Arizona's largest employers, ahead of the State of Arizona and Walmart (hoodline.com).
Behind it come office and service jobs. Professional, scientific, management, administrative and waste services employ 13.4% of county workers, and retail employs 11.8%. Together with education and health care, those groups account for a large part of what Valley residents do all day.
More hard hats, fewer factory floors
The construction share in Maricopa County runs 1 percentage point above the national share. Manufacturing runs 2 percentage points below it. Both gaps are bigger than the margin of error, so they reflect a real difference in how the Valley's workforce is built.
For job seekers, that tilt matters. Construction work here often means long days on open job sites through the summer heat, and it ties paychecks closely to how many houses and buildings are going up on the Valley's edges.
Trucking, warehousing and utilities are a different story. That group employs 6% of county workers, compared with 5.9% nationally, a difference within the margin of error. On this measure, the Valley looks like the rest of the country.
How the Valley stacks up against Sun Belt rivals
Set beside the home counties of comparable metros — Dallas County, Harris County around Houston, Riverside County in Southern California, Clark County around Las Vegas and Fulton County around Atlanta — the picture shifts. Maricopa County has the second-highest share of workers in education and health care in that group, even though it trails the nation.
On construction, Maricopa ranks fourth-highest. The Valley leans on building more than the U.S. does, but by the standard of other fast-growing Southern and Western counties, it sits in the middle of the pack.
The broader job picture has been uneven. Phoenix-area jobs barely grew in 2025 under revised federal estimates (Forecasting Project), though nonfarm payroll employment in the metro rose over the most recent year (Arizona's Economy).
The outlook for the Valley's builders is cooler. Housing permits are forecast to fall in 2026 and again in 2027 as permit activity responds to higher mortgage rates and slowing population gains (Forecasting Project). In a county where construction claims a bigger slice of the workforce than it does nationally, that forecast matters to more working households.
About the data
We used the Census Bureau's American Community Survey multiyear estimates for 2020 through 2024 to compare the share of employed civilian residents in each industry group in Maricopa County with Arizona and the U.S. We also ranked Maricopa against the principal counties of peer metros — Dallas, Harris, Riverside, Clark and Fulton — and checked whether gaps with the nation exceeded the survey's margins of error.
- These are survey estimates pooled across 2020 through 2024, so they carry margins of error and smooth over year-to-year changes.
- The figures classify residents by the industry they work in, not the jobs located inside the county, so commuters are counted where they live.
- Broad industry groups lump together very different jobs, so the data can't show how many workers are in specific fields such as semiconductors or hospitals alone.
Percentage point: the simple difference between percentages, such as the gap between a county's share and the national share. Principal county: the largest or central county of a metro area, used here to compare Maricopa with similar regions.
Sources
- U.S. Census Bureau, American Community Survey: Industry by Occupation for the Civilian Employed Population 16 Years and Over (ACS 5-year 2020–2024), latest period 2024; retrieved Oct. 17, 2026. Data
All times MST.


Read the news on Google? Make The Phoenix Courier a preferred source and you’ll see more of our stories in Top Stories.
More from The Courier



Comments
Sign in to join the conversation. Comments are free for every reader.
Loading comments…