In Pinal County, hail comes more often than in Maricopa but costs far less
Pinal ranks second in Arizona for hail events on record, while Maricopa's expected yearly hail loss runs 25.3 times Pinal's.
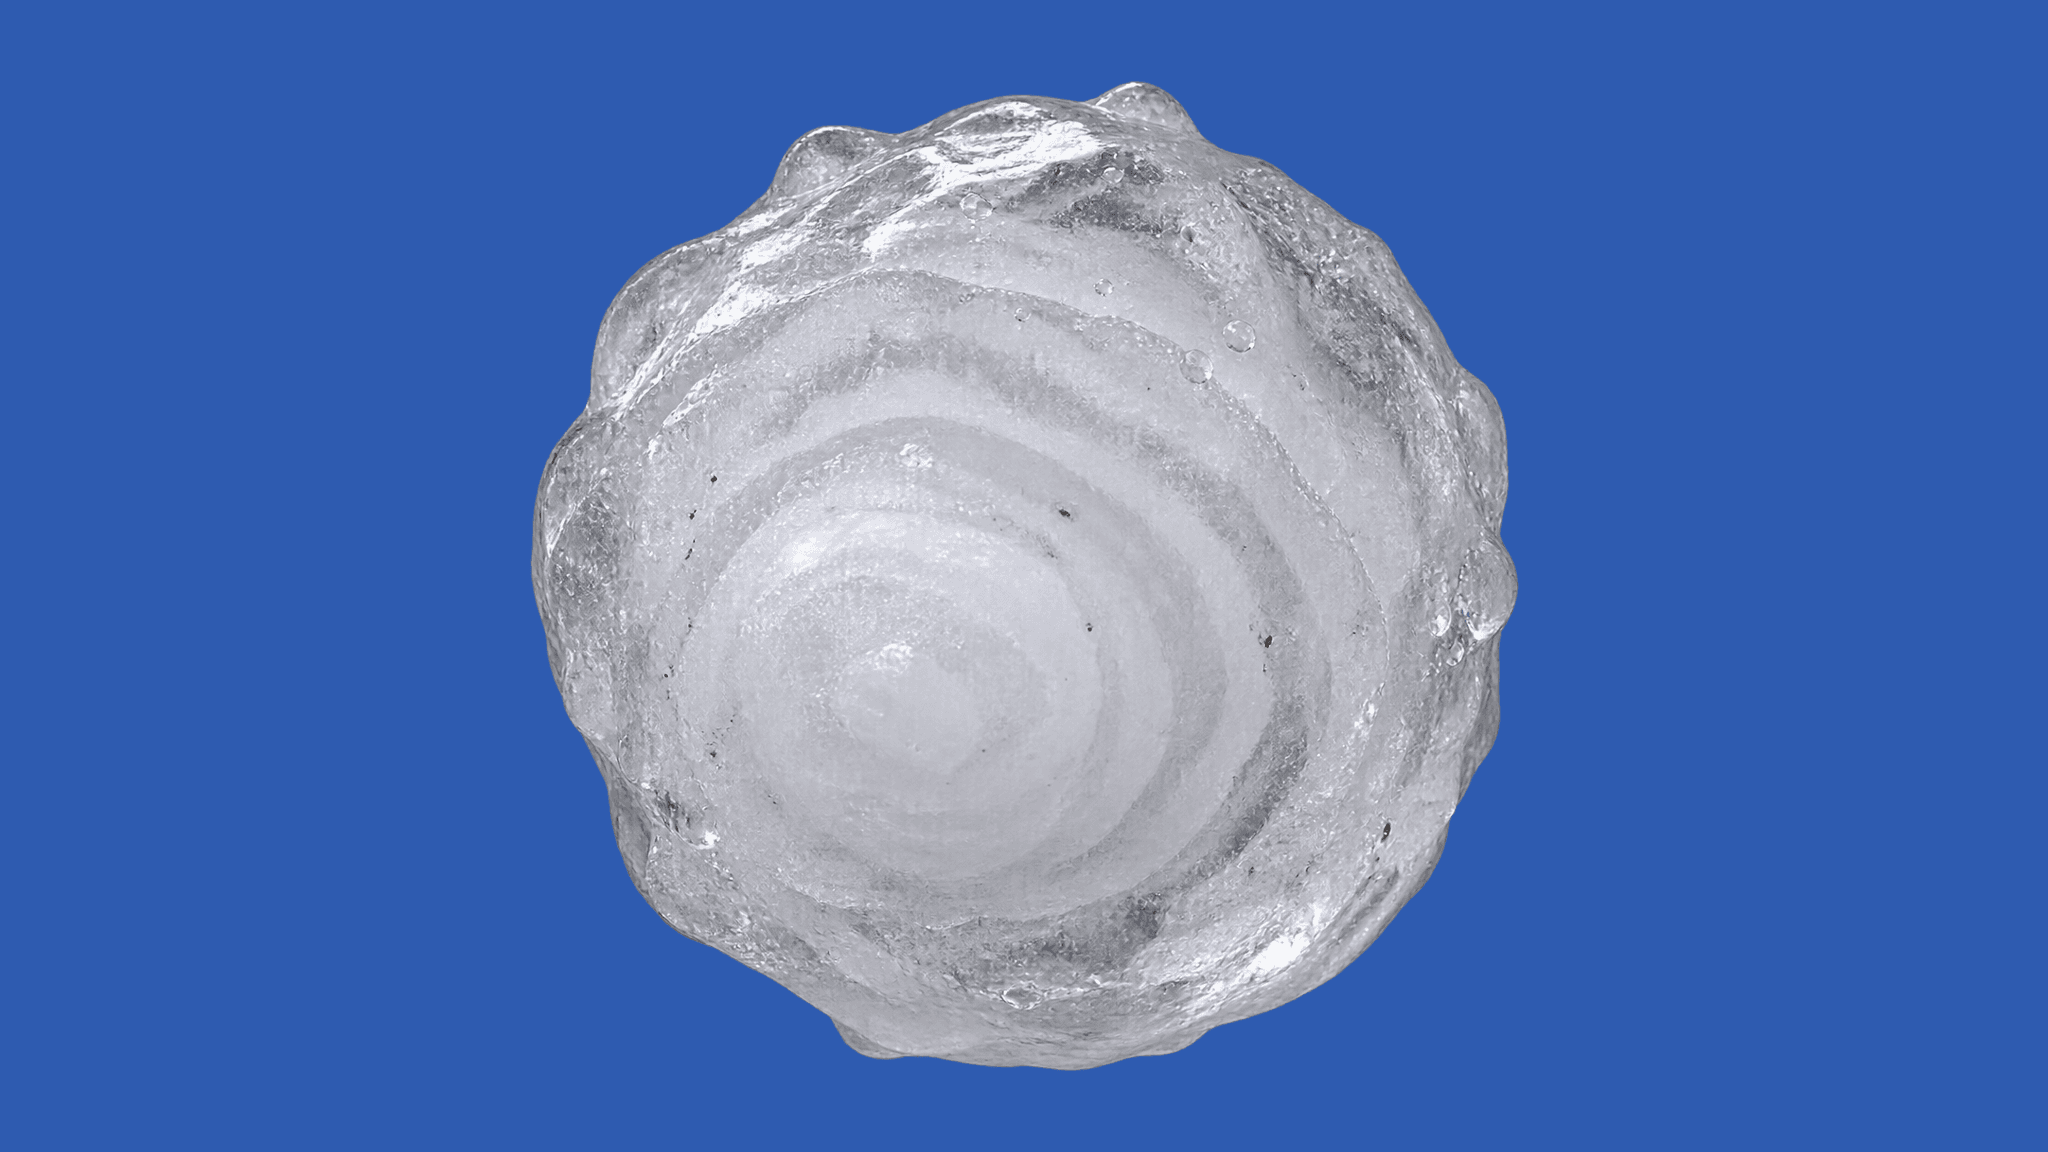
Pinal County gets hail more often than Maricopa County does. Maricopa is still where hail costs Arizona the most money.
Maricopa County ranks first among Arizona's counties for expected yearly hail losses, at $24.2 million a year, according to FEMA's National Risk Index. Pinal County, next door, ranks fourth at $953,772 a year.
Across the state, the gap is wide. Maricopa's expected hail bill runs 25.3 times Pinal's, and of all the hail losses the index expects in Arizona in a typical year, just over 4 in 5 dollars land in Maricopa County.
Less hail, bigger bill
The count of hail events points the other way. Over the index's period of record, Maricopa County logged 10.6 events, which ranks fifth in the state.
Pinal County logged 14.8 events, second in Arizona. Yavapai County, with 16.4 events, logged more than either of them.
The county at the top of the loss list sits in the middle of the pack for hail itself. Maricopa doesn't see the most storms. When hail does fall from Glendale to Scottsdale, though, more is at stake under it than anywhere else in the state.
Ordinary by national standards
Measured against counties nationwide, the Valley's hail risk looks unremarkable. Maricopa's hail loss rate, which weighs expected losses against the value of what is exposed, ranks at the 56.9 national percentile among U.S. counties.
Valley homeowners land a little above the national middle. Pinal County's rate sits well below it, at the 35.9 national percentile.
What a bad hail day looks like here
Arizona's costliest weather event on record was, in large part, a hail event (Wikipedia). Homes were damaged throughout Maricopa County, forcing a wave of insurance claims (Wikipedia).
Hail as big as golf balls and baseballs damaged roofs and vehicles across a wide area (Wikipedia). Elsewhere, tennis ball-sized stones damaged roofs, vehicles and aircraft (Wikipedia).
Smaller hail days fill the National Weather Service's storm summaries, too. One October brought damaging winds and hail across Glendale (weather.gov). Another October event brought flash flooding, damaging winds, large hail and a landspout tornado (weather.gov), and a November storm brought flooding, a tornado and large hail that piled up on the ground (weather.gov).
For Valley drivers and homeowners weighing comprehensive auto or home coverage, the numbers cut both ways. Hail falls here less often than it does in Pinal or Yavapai counties. But no county in Arizona has more riding on the storms that do arrive.
About the data
We used county-level hail figures from the latest version of FEMA's National Risk Index, released in December 2025. We ranked Arizona's counties by hail expected annual loss and by the number of hail events in the index's period of record, then compared Maricopa County with neighboring Pinal County and with U.S. counties nationally using the index's loss-rate percentiles.
- Expected annual loss is a modeled long-run average, not a count of actual insurance claims or damage in any given year.
- Hail event counts in the index are modeled figures, which is why they can include fractions.
- The index works at the county level and cannot show which neighborhoods or cities within Maricopa or Pinal counties face the most hail damage.
Expected annual loss: FEMA's estimate of the average dollar damage a hazard is likely to cause in a county each year, combining how often it strikes with the value of buildings, people and crops exposed to it. Loss rate percentile: where a county's expected losses, measured against the value of what is exposed, fall among all U.S. counties; a higher percentile means a higher rate. Landspout tornado: a typically weaker tornado that forms from the ground up rather than descending from a rotating thunderstorm.
Sources
- Federal Emergency Management Agency (FEMA), National Risk Index: FEMA National Risk Index by hazard (Hail), every county in state FIPS 04 (National Risk Index v1.20.0 (December 2025)), latest period December 2025; retrieved Oct. 23, 2026. Data
All times MST.


Read the news on Google? Make The Phoenix Courier a preferred source and you’ll see more of our stories in Top Stories.
More from The Courier


Comments
Sign in to join the conversation. Comments are free for every reader.
Loading comments…