Price cuts reach 50.0% of Maricopa County listings as asking prices fall
The share is up slightly from 49.0% a year ago but ranks 6th among Septembers in the data, while the median asking price fell 5.0% to $499,000.
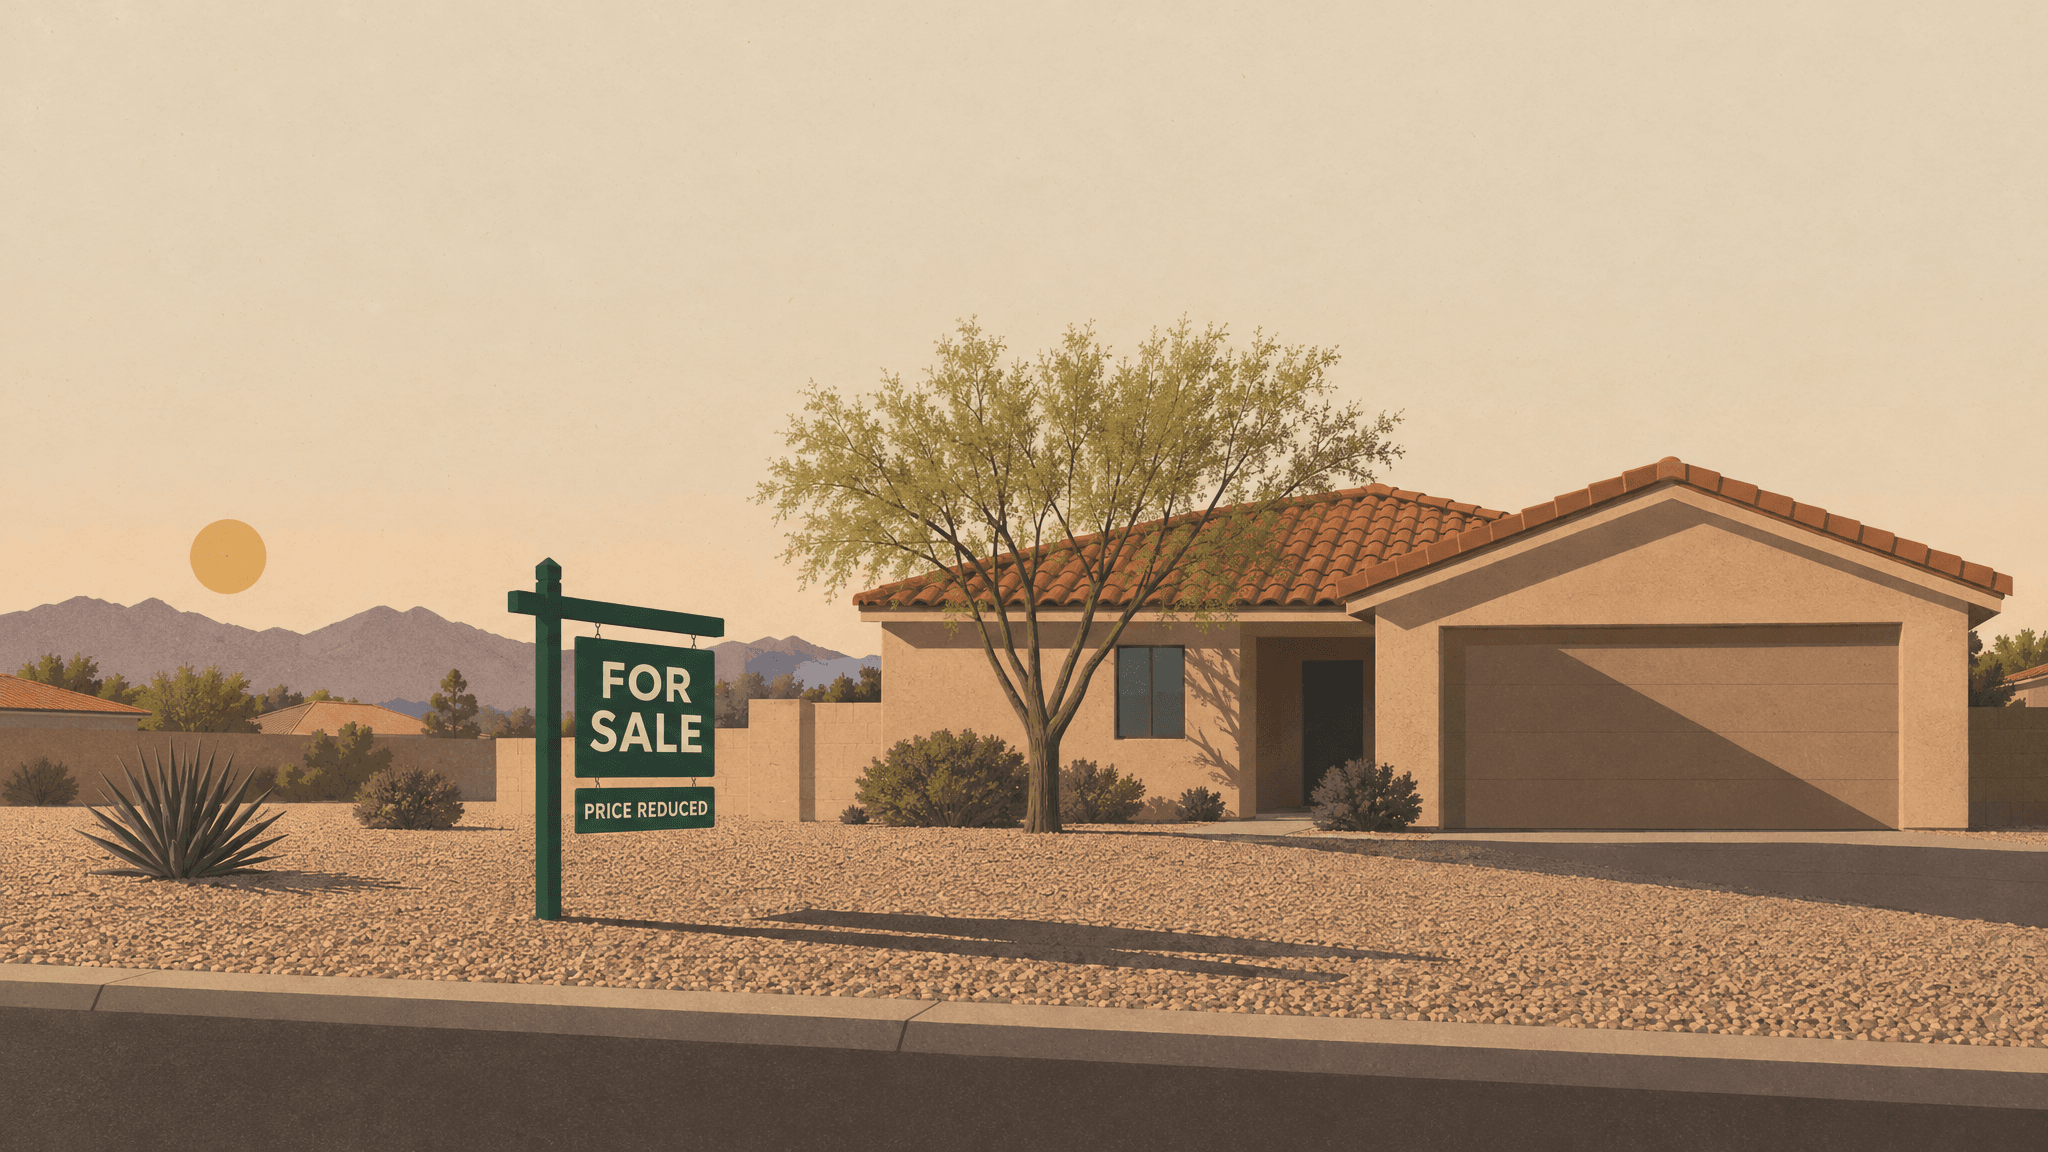
Asking prices across the Valley have slipped from a year ago, and sellers are still trimming them often as the fall and winter buying season begins. The typical Maricopa County home listed in September 2026 was priced at $499,000.
That is down 5.0% from $525,000 in September 2025, according to monthly listing data posted October 1. For buyers, it means the typical asking price is lower than it was last fall.
Other measures show how much room buyers may have. These are how many sellers have cut their price and how long homes sit before they sell. Both remain high by the standards of the past decade, but neither hit a new peak this September.
Price cuts are common, but not a record
In September 2026, 50.0% of active listings in Maricopa County carried a reduced price. That rose from 49.0% in September 2025.
The share is high, but it is not the highest on record. Among the Septembers from 2016 through 2026, this year ranks 6th. Earlier Septembers saw an even larger share of sellers lower their asking price.
The data is not adjusted for the time of year. Price cuts can rise and fall with the seasons, so the fairest test compares September with past Septembers. Measured against every month since July 2016, September 2026 ranks 59th.
For sellers, the takeaway is plain. A price cut is now routine in the Valley, not a sign that something is wrong with a home. For buyers, a listing that has already been cut may signal a seller ready to talk.
The data does not show how big those cuts are. A small trim and a steep markdown count the same. It also tracks asking prices, not the prices homes finally sell for.
Homes are taking longer to sell
The median Maricopa County listing spent 61.0 days on the market in September 2026. That is down from 65.0 days in September 2025.
Even with that small improvement, this fall's wait is long by local standards. It ranks 2nd-longest among the Septembers since 2016. Only last September's wait was longer.
So the answer to whether sellers are waiting longer than at any point since 2016 is no, but close. The wait eased slightly from a year ago. Price cuts, meanwhile, ticked up but stayed below earlier peaks.
Taken together, the numbers point to a market where buyers have more time and more leverage than in many recent years. They do not, on their own, prove the Valley has become a buyer's market.
How Valley prices compare with the nation
Valley homes still list for more than the typical home nationwide. In August 2026, the latest month available, Maricopa County's median listing price measured against the national median came to 1.2 ratio to U.S..
That matches August 2025, when the county's figure was also 1.2 ratio to U.S.. In other words, local asking prices have stayed above the national level by about the same margin over the past year.
Prices also differ within the Valley. A market report from JVM Lending described the city of Phoenix as more moderate on price than the wider area (JVM Lending). The same report said Chandler's median sale price was down from a year earlier (JVM Lending).
Those figures come from a commercial source, not an official one, and they track sale prices rather than asking prices. They are not directly comparable with the county listing data in this story.
The county listing data shows what changed, not why. JVM Lending has offered some context. The company said mortgage rates have stabilized (JVM Lending), and that more homeowners are choosing to list their properties as rates remain stable (JVM Lending).
The report also said new construction remains active across Maricopa and Pinal counties (JVM Lending). That means resale sellers in the East Valley, West Valley and Phoenix itself are also competing with builders for the same buyers.
The listing data in this story covers Maricopa County as a whole. It cannot show whether price cuts or long waits are more common in places like Maryvale, Laveen or South Phoenix than in the suburbs.
What to watch: The next monthly release will show whether the share of price-reduced listings keeps climbing into the late fall. It will also show whether time on market moves back toward last year's long wait.
Buyers should also watch whether the drop in the median asking price holds. Another year-over-year decline would add to signs that sellers have less pricing power than they did in recent years.
How we did this
We used monthly listing data for Maricopa County covering July 2016 through September 2026, posted October 1. The data is not adjusted for season, so we compared September 2026 mainly with earlier Septembers, ranking the price-reduced share (50.0%) and median days on market (61.0 days) against each September since 2016. We compared the county's median listing price with the U.S. median using the latest available month, August 2026.
Median listing price: the middle asking price among homes listed for sale. Equal numbers of listings ask more and ask less. Price-reduced share: the portion of active listings whose asking price has been lowered since the home was first put up for sale. Median days on market: the middle number of days listings have been on the market. Equal numbers of listings have been up longer and shorter. Active listings: homes currently listed for sale and not yet under contract or sold. Ratio to U.S.: the county's median listing price divided by the national median listing price. A higher ratio means Valley asking prices sit further above the national typical asking price.
Limitations
- Listing prices are what sellers ask, not what homes sell for. Final sale prices may be higher or lower.
- The data is not seasonally adjusted, so comparing September with other months of the year can be misleading. Same-month comparisons are fairer.
- The price-reduced share counts any cut, large or small. It does not show how much sellers lowered their prices.
- The figures cover Maricopa County as a whole and cannot show differences between neighborhoods or cities.
- The national comparison uses August 2026, the latest month available, not September.
- Market details for the city of Phoenix and Chandler come from a commercial lender's report, not an official source, and use sale prices rather than listing prices.
- The listing data shows what changed in the market, not what is behind those shifts. Context about market conditions comes from the lender's report and is credited where it appears.
Sources
- Federal Reserve Bank of St. Louis (FRED): Housing Inventory: Median Listing Price in Maricopa County, AZ, latest period September 2026, released Oct. 1, 2026; retrieved Oct. 12, 2026. Data
- Federal Reserve Bank of St. Louis (FRED): Housing Inventory: Median Listing Price Year-Over-Year in Maricopa County, AZ, latest period September 2026, released Oct. 1, 2026; retrieved Oct. 12, 2026. Data
- Federal Reserve Bank of St. Louis (FRED): Housing Inventory: Price Reduced Count in Maricopa County, AZ, latest period September 2026, released Oct. 1, 2026; retrieved Oct. 12, 2026. Data
- Federal Reserve Bank of St. Louis (FRED): Housing Inventory: Active Listing Count in Maricopa County, AZ, latest period September 2026, released Oct. 1, 2026; retrieved Oct. 12, 2026. Data
- Federal Reserve Bank of St. Louis (FRED): Housing Inventory: Median Days on Market in Maricopa County, AZ, latest period September 2026, released Oct. 1, 2026; retrieved Oct. 12, 2026. Data
- Federal Reserve Bank of St. Louis (FRED): Market Hotness: Median Listing Price Versus the United States in Maricopa County, AZ, latest period August 2026, released Sept. 10, 2026; retrieved Oct. 12, 2026. Data
All times MST.
More from The Courier
Comments
Sign in to join the conversation. Comments are free for every reader.
Loading comments…